A new SmartAsset study ranking the 90 largest U.S. cities by happiness puts Detroit at No. 88, based on key metrics like income, mental and physical health, and quality of life.
While measuring individual happiness is subjective, broader trends — like higher incomes, longer life expectancy and stronger community ties — can offer insight into where Americans are more likely to thrive. With that in mind, SmartAsset evaluated cities across 11 data points to find where people are happiest.
Key Findings
- Plano, Texas, is the happiest big city in America. Plano ranks among the top 10 for various happiness metrics, overtaking Arlington, Virginia,for the number one spot this year. Notably, it ranks first studywide for the highest rate of marriage at 55.9%. Its residents also report the fourth-most mentally healthy health days at 84.8%. Poverty is also fifth-lowest at 7.0%.
- 60% of households or more earn over $100,000 in the Bay Area. Fremont, California, ranks first for this metric with 71.9% of households earning at least six figures. San Jose, California, (62.2%), Irvine, California, (61.7%), and San Francisco (58.1%) also rank among the top five places with people earning at this level.
- Housing is most affordable for residents of these Midwestern cities. Fort Wayne, Indiana, has the lowest rate of residents struggling to pay for housing, with only 10.5% paying more than half of their income for a roof over their heads. Boise, Idaho, (10.9%); Wichita, Kansas, (11.5%); Pittsburgh, (11.9%); and Oklahoma City, (11.9%) are also among the top five cities where residents can comfortably afford housing.
- Residents are expected to live to nearly 84 years old in Arlington, Virginia. The second-happiest city nationwide maintains the highest life expectancy at 83.9 years old. On the other hand, residents of Memphis, Tennessee, have the lowest life expectancy at 71.8 years.
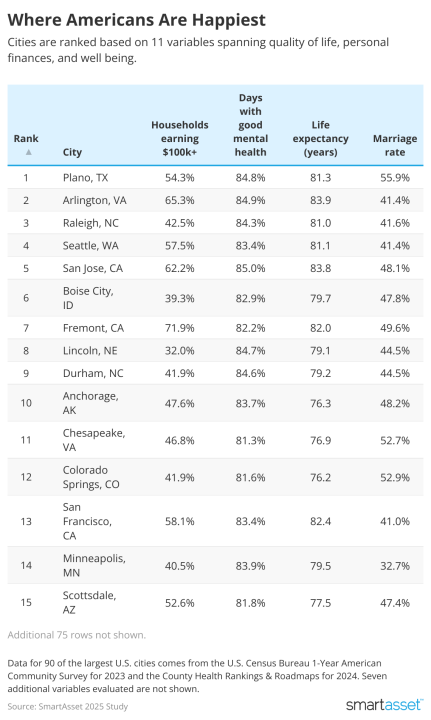
Top 10 Happiest Cities
1. Plano, Texas
- Households earning $100,000 or more: 54.3%
- Poverty rate: 7%
- Households spending 50% or more of income on housing: 13%
- Days with good mental health: 84.8%
- Life expectancy: 81.31 years
- Residents getting exercise: 0.826
- Population covered by health insurance: 90.3%
- Population with adequate access to physical activity: 93%
- Rate of overcrowding: 2.8%
- Marriage rate: 55.9%
- Average traffic volume: 140.65
2. Arlington, Virginia
- Households earning $100,000 or more: 65.3%
- Poverty rate: 6.9%
- Households spending 50% or more of income on housing: 14.2%
- Days with good mental health: 84.9%
- Life expectancy: 83.94 years
- Residents getting exercise: 0.830
- Population covered by health insurance: 96.4%
- Population with adequate access to physical activity: 100%
- Rate of overcrowding: 3.4%
- Marriage rate: 41.4%
- Average traffic volume: 540
3. Raleigh, North Carolina
- Households earning $100,000 or more: 42.5%
- Poverty rate: 10.3%
- Households spending 50% or more of income on housing: 12%
- Days with good mental health: 84.3%
- Life expectancy: 80.99 years
- Residents getting exercise: 0.842
- Population covered by health insurance: 91.9%
- Population with adequate access to physical activity: 98.6%
- Rate of overcrowding: 2%
- Marriage rate: 41.6%
- Average traffic volume: 111.59
4. Seattle
- Households earning $100,000 or more: 57.5%
- Poverty rate: 9.9%
- Households spending 50% or more of income on housing: 15%
- Days with good mental health: 83.4%
- Life expectancy: 81.06 years
- Residents getting exercise: 0.867
- Population covered by health insurance: 95.7%
- Population with adequate access to physical activity: 97.9%
- Rate of overcrowding: 3.9%
- Marriage rate: 41.4%
- Average traffic volume: 332.97
5. San Jose, California
- Households earning $100,000 or more: 62.2%
- Poverty rate: 8.5%
- Households spending 50% or more of income on housing: 15.7%
- Days with good mental health: 85%
- Life expectancy: 83.79 years
- Residents getting exercise: 0.809
- Population covered by health insurance: 95.1%
- Population with adequate access to physical activity: 99.4%
- Rate of overcrowding: 7.9%
- Marriage rate: 48.1%
- Average traffic volume: 626.36
6. Boise City, Idaho
- Households earning $100,000 or more: 39.3%
- Poverty rate: 9.9%
- Households spending 50% or more of income on housing: 10.9%
- Days with good mental health: 82.9%
- Life expectancy: 79.74 years
- Residents getting exercise: 0.824
- Population covered by health insurance: 92.7%
- Population with adequate access to physical activity: 91.6%
- Rate of overcrowding: 1.9%
- Marriage rate: 47.8%
- Average traffic volume: 116.67
7. Fremont, California
- Households earning $100,000 or more: 71.9%
- Poverty rate: 5.4%
- Households spending 50% or more of income on housing: 18.1%
- Days with good mental health: 82.2%
- Life expectancy: 81.98 years
- Residents getting exercise: 0.812
- Population covered by health insurance: 97.6%
- Population with adequate access to physical activity: 99.6%
- Rate of overcrowding: 7.7%
- Marriage rate: 49.6%
- Average traffic volume: 683.02
8. Lincoln, Nebraska
- Households earning $100,000 or more: 32%
- Poverty rate: 12.2%
- Households spending 50% or more of income on housing: 12.6%
- Days with good mental health: 84.7%
- Life expectancy: 79.09 years
- Residents getting exercise: 0.789
- Population covered by health insurance: 94.7%
- Population with adequate access to physical activity: 95.4%
- Rate of overcrowding: 2.2%
- Marriage rate: 44.5%
- Average traffic volume: 211.07
9. Durham, North Carolina
- Households earning $100,000 or more: 41.9%
- Poverty rate: 10%
- Households spending 50% or more of income on housing: 13.4%
- Days with good mental health: 84.6%
- Life expectancy: 79.19 years
- Residents getting exercise: 0.809
- Population covered by health insurance: 89.4%
- Population with adequate access to physical activity: 90.7%
- Rate of overcrowding: 2.9%
- Marriage rate: 44.5%
- Average traffic volume: 134.11
10. Anchorage, Alaska
- Households earning $100,000 or more: 47.6%
- Poverty rate: 8.4%
- Households spending 50% or more of income on housing: 13.2%
- Days with good mental health: 83.7%
- Life expectancy: 76.34 years
- Residents getting exercise: 0.801
- Population covered by health insurance: 92.3%
- Population with adequate access to physical activity: 93.9%
- Rate of overcrowding: 4.5%
- Marriage rate: 48.2%
- Average traffic volume: 152.30
Follow Metro Parent on Instagram.
from Metro Parent https://ift.tt/set2Ri6


0 comments:
Post a Comment